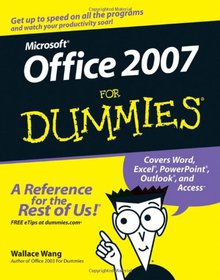
Microsoft Office 2007
For Dummies

Book Details:
| Publisher: | For Dummies |
| Series: | Wiley , For Dummies |
| Author: | Wallace Wang |
| Edition: | 1 |
| ISBN-10: | 0470009233 |
| ISBN-13: | 9780470009239 |
| Pages: | 432 |
| Published: | Dec 26 2006 |
| Posted: | Nov 19 2014 |
| Language: | English |
| Book format: | |
| Book size: | 18.18 MB |
Book Description:
Find and use the features you need right awayCreate great documents, Excel charts, and slide shows, and organize your e-mailWhat's new at the Office? A lot, and this book takes you through all the cool changes and enhancements so you can rev up and go. Find your way around the new interface, dress up your documents, create spreadsheets that actually make sense, give presentations that wow your audience, and organize your life.Discover how toLocate commands on the RibbonUse Live PreviewStop spam with Outlook(r)Format and enhance Word documentsWork with Excel(r) formulasStore and find data in Access
Download Link:
Related Books:
Microsoft Office Groove 2007
Step by Step
Experience learning made easy quickly learn how to use Office Groove 2007 to dynamically and effectively collaborate with team members. Work at your own pace through the easy numbered steps, practice files on CD, helpful hints, and troubleshooting tips and learn how to work better together. You ll learn the basics for getting started, including how to manage your Groove 2007 accounts and contacts and how to create new workspaces. After you re up and running, you'll discover the communication features of Groove 2007, and see the benefits of tight integration with Office Communicator and Windows LiveTM Messenger. You ll learn how to manage your messages and chat in real time, and how to manage your appointments and notes. With STEP BY STEP, you can tak...
Create Dynamic Charts in Microsoft Office Excel 2007
Extend your Excel 2007 skills and create more-powerful and compelling charts in less time. Guided by an Excel expert, you will learn how to turn flat, static charts into dynamic solutions where you can visualize and manipulate data countless ways with a simple mouse click. Get the hands-on practice and examples you need to produce your own, professional-quality results. No programming required! Maximize the impact of your ideas and data! Learn how your design decisions affect perception and comprehension. Match the right chart type to your communication objective. Visualize then buildyour solution using the author's five-step approach. Apply the science of color to make the right things pop. Add controls such as drop-down lists and scroll bars withou...
Microsoft Office Excel 2007 Data Analysis
Your Visual Blueprint for Creating and Analyzing Data, Charts, and PivotTables
Welcome to the only guidebook series that takes a visual approach to professional-level computer topics. Open the book and you'll discover step-by-step screen shots that demonstrate over 110 Excel data analysis techniques, including:* Identifying trends in your data*Sorting, filtering, and identifying lists*Creating, editing, and checking formulas*Calculating interest rates and depreciation*Performing simple sorts and filters*Hiding rows or columns in a PivotTable*Adding and removing chart data*Querying an Access database*Assigning digital signatures*Solving a formula with a data table"I was stuck on an Excel problem for two days. Finally, I opened one of your books, and there was a macro to accomplish exactly what I needed! You made me look goo...
2007 - 2021 © eBooks-IT.org


