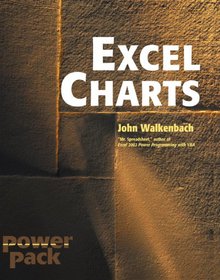
Excel Charts

Book Details:
| Publisher: | Wiley |
| Series: | Wiley |
| Author: | John Walkenbach |
| Edition: | 1 |
| ISBN-10: | 0764517643 |
| ISBN-13: | 9780764517648 |
| Pages: | 552 |
| Published: | Nov 29 2002 |
| Posted: | Nov 19 2014 |
| Language: | English |
| Book format: | |
| Book size: | 11.45 MB |
Book Description:
* One of the world's best-known Excel experts shows how to master the charting features in Excel 2000 and 2002 to create compelling graphic representations of data* Covers basic and advanced features, focusing on the new charting featuresprovided in version 2002* Explains how to select charts for different categories of data, modify data in a chart, deal with missing data, format charts, customize shapes, and give charts a professional look
Download Link:
Related Books:
Create Dynamic Charts in Microsoft Office Excel 2007
Extend your Excel 2007 skills and create more-powerful and compelling charts in less time. Guided by an Excel expert, you will learn how to turn flat, static charts into dynamic solutions where you can visualize and manipulate data countless ways with a simple mouse click. Get the hands-on practice and examples you need to produce your own, professional-quality results. No programming required! Maximize the impact of your ideas and data! Learn how your design decisions affect perception and comprehension. Match the right chart type to your communication objective. Visualize then buildyour solution using the author's five-step approach. Apply the science of color to make the right things pop. Add controls such as drop-down lists and scroll bars withou...
Microsoft Office Excel 2007 Data Analysis
Your Visual Blueprint for Creating and Analyzing Data, Charts, and PivotTables
Welcome to the only guidebook series that takes a visual approach to professional-level computer topics. Open the book and you'll discover step-by-step screen shots that demonstrate over 110 Excel data analysis techniques, including:* Identifying trends in your data*Sorting, filtering, and identifying lists*Creating, editing, and checking formulas*Calculating interest rates and depreciation*Performing simple sorts and filters*Hiding rows or columns in a PivotTable*Adding and removing chart data*Querying an Access database*Assigning digital signatures*Solving a formula with a data table"I was stuck on an Excel problem for two days. Finally, I opened one of your books, and there was a macro to accomplish exactly what I needed! You made me look goo...
Beginning JavaScript Charts
With jqPlot, d3, and Highcharts
BeginningJavaScript Charts shows how to convert your data into eye-catching, innovative, animated, and highly interactive browser-based charts. This book is suitable for developers of all experience levels and needs: for those who love fast and effective solutions, you can use the jqPlot library to generate charts with amazing effects and animations using only a few lines of code; if you want more power and need to create data visualization beyond traditional charts, then D3 is the JavaScript library for you; finally, if you need a high-performance, professional solution for interactive charts, then the Highcharts library is also covered.If you are an experienced developer and want to take things further, thenBeginningJavaScript Charts also shows you...
2007 - 2021 © eBooks-IT.org


