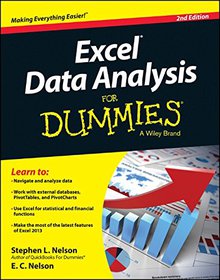
Excel Data Analysis
For Dummies
2nd Edition

Book Details:
| Publisher: | For Dummies |
| Series: | Wiley , For Dummies |
| Author: | Stephen L. Nelson |
| Edition: | 2 |
| ISBN-10: | 1118898095 |
| ISBN-13: | 9781118898093 |
| Pages: | 360 |
| Published: | May 05 2014 |
| Posted: | Nov 19 2014 |
| Language: | English |
| Book format: | |
| Book size: | 32.05 MB |
Book Description:
Harness the power of Excel to discover what your numbers are hidingExcel Data Analysis For Dummies, 2nd Edition is the ultimate guide to getting the most out of your data. Veteran Dummies author Stephen L. Nelson guides you through the basic and not-so-basic features of Excel to help you discover the gems hidden in your rough data. From input, to analysis, to visualization, the book walks you through the steps that lead to superior data analysis.Excel is the number-one spreadsheet application, with ever-expanding capabilities. If you're only using it to balance the books, you're missing out on a host of functions that can benefit your business or personal finances by uncovering trends and other important information hidden within the numbers. Excel Data Analysis For Dummies, 2nd Edition eliminates the need for advanced statistics or analysis courses by allowing you to harness the full power of Excel to do the heavy lifting for you. This 2nd Edition is fully updated to include information about Excel's latest features, making it a your go-to Excel guide for data analysis. Topics include:Working with external databasesPivotTables and PivotChartsUsing Excel for statistical and financial functionsSolver, Small Business Finance Manager, and moreThe book also includes a guide to chart types and formatting, and advice on effective visual data presentation. You already have the data, so you might as well get something great out of it. Excel Data Analysis For Dummies, 2nd Edition is the key to discovering what your numbers are hiding.
Download Link:
Related Books:
Microsoft Office Excel 2007 Data Analysis
Your Visual Blueprint for Creating and Analyzing Data, Charts, and PivotTables
Welcome to the only guidebook series that takes a visual approach to professional-level computer topics. Open the book and you'll discover step-by-step screen shots that demonstrate over 110 Excel data analysis techniques, including:* Identifying trends in your data*Sorting, filtering, and identifying lists*Creating, editing, and checking formulas*Calculating interest rates and depreciation*Performing simple sorts and filters*Hiding rows or columns in a PivotTable*Adding and removing chart data*Querying an Access database*Assigning digital signatures*Solving a formula with a data table"I was stuck on an Excel problem for two days. Finally, I opened one of your books, and there was a macro to accomplish exactly what I needed! You made me look goo...
Excel 2013 Pivot Tables: Smart Data Analysis: Including the Data Model
Volume 2
Excel 2013 Pivot Tables Including the "Data Model" A pivot table is a simple, yet powerful technique, that enables Excel's users to transform data overload into meaningful and organized knowledge. With pivot tables you can: * See the data in dozens of different ways with a simple mouse drag * Perform fast calculations with no need for formulas * Focus on another part of the data each time and get a clear picture * Show more trends and patterns * Create dozens of reports and charts to analyze your data While reading the book and using the practice files, you will know to: Create a Pivot Table oSelect data from the current file oSelec data from another Excel file oChange the data source oCreate a pivot table based on a dynamic data table Perf...
Excel 2007 Data Analysis
For Dummies
Shows ordinary users how to tap the rich data analysis functionality of Excel, make sense of their organization's critical financial and statistical information, and put together compelling data presentationsNow revised with over 30 percent new content to cover the enhancements in Excel 2007, including the completely redesigned user interface, augmented charting and PivotTable capabilities, improved security, and better data exchange through XMLProvides thorough coverage of Excel features that are critical to data analysis-working with external databases, creating PivotTables and PivotCharts, using Excel statistical and financial functions, sharing data, harnessing the Solver, taking advantage of the Small Business Finance Manager, and more...
2007 - 2021 © eBooks-IT.org


