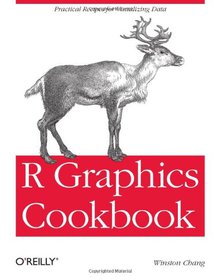
R Graphics Cookbook

Book Details:
| Publisher: | O'Reilly Media |
| Series: | OReilly , Cookbook |
| Author: | Winston Chang |
| Edition: | 1 |
| ISBN-10: | 1449316956 |
| ISBN-13: | 9781449316952 |
| Pages: | 416 |
| Published: | Jan 06 2013 |
| Posted: | Nov 19 2014 |
| Language: | English |
| Book format: | |
| Book size: | 32.4 MB |
Book Description:
This practical guide provides more than 150 recipes to help you generate high-quality graphs quickly, without having to comb through all the details of R's graphing systems. Each recipe tackles a specific problem with a solution you can apply to your own project, and includes a discussion of how and why the recipe works. Most of the recipes use the ggplot2 package, a powerful and flexible way to make graphs in R. If you have a basic understanding of the R language, you're ready to get started. Use R's default graphics for quick exploration of data Create a variety of bar graphs, line graphs, and scatter plots Summarize data distributions with histograms, density curves, box plots, and other examples Provide annotations to help viewers interpret data Control the overall appearance of graphics Render data groups alongside each other for easy comparison Use colors in plots Create network graphs, heat maps, and 3D scatter plots Structure data for graphing
Download Link:
Related Books:
Guidebook to R Graphics Using Microsoft Windows
Introduces the graphical capabilities of R to readers new to the softwareDue to its flexibility and availability, R has become the computing software of choice for statistical computing and generating graphics across various fields of research. Guidebook to R Graphics Using Microsoft Windows offers a unique presentation of R, guiding new users through its many benefits, including the creation of high-quality graphics.Beginning with getting the program up and running, this book takes readers step by step through the process of creating histograms, boxplots, strip charts, time series graphs, steam-and-leaf displays, scatterplot matrices, and map graphs. In addition, the book presents: Tips for establishing, saving, and printing graphs along with essen...
Python 2.6 Graphics Cookbook
This book has recipes that show enthusiastic users how easy graphic programming can be. Simple explanations in plain English are used. The recipes are built up, in each chapter, starting as simply as possible and moving to more complex programs with which you can comfortably create 2D vector graphics and animations. You will learn how to combine both vector and photo images seamlessly! If you are looking to create animated graphics to represent real-world scenarios then this book is for you. Teachers, scholars, students, and engineers who know it is possible to make fascinating models and demonstrations but have not found a handbook that pulls it all together in one place will find what they need in this recipe bank. Basic knowledge of Python program...
R Cookbook
With more than 200 practical recipes, this book helps you perform data analysis with R quickly and efficiently. The R language provides everything you need to do statistical work, but its structure can be difficult to master. This collection of concise, task-oriented recipes makes you productive with R immediately, with solutions ranging from basic tasks to input and output, general statistics, graphics, and linear regression.Each recipe addresses a specific problem, with a discussion that explains the solution and offers insight into how it works. If you're a beginner, R Cookbook will help get you started. If you're an experienced data programmer, it will jog your memory and expand your horizons. You'll get the job done faster and learn more about R...
2007 - 2021 © eBooks-IT.org


