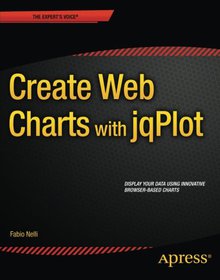
Create Web Charts with jqPlot

Book Details:
| Publisher: | Apress |
| Series: | Apress |
| Author: | Fabio Nelli |
| Edition: | 1 |
| ISBN-10: | 1484208633 |
| ISBN-13: | 9781484208632 |
| Pages: | 268 |
| Published: | Nov 21 2014 |
| Posted: | Jan 28 2015 |
| Language: | English |
| Book format: | |
| Book size: | 7.99 MB |
Book Description:
Create Web Charts with jqPlotshows how to convert your data into eye-catching, innovative, animated, and highly interactive browser-based charts. This book is suitable for developers of all experience levels and needs: for those who love fast and effective solutions, you can use the jqPlot library to generate charts with amazing effects and animations using only a few lines of code.By the end of the book, you will have a good knowledge of all the elements needed to manage data from every possible source, from high-end scientific instruments to Arduino boards, from simple HTML tables to structured JSON files, and from Matlab calculations to reports in Excel. You will be able to provide cutting-edge charts exploiting the growing power of modern browsers.This book contains content previously published in Beginning JavaScript Charts.Create all kinds of charts using the latest technologies available on browsersFull of step-by-step examples, Create Web Charts with jqPlot introduces you gradually to all aspects of chart development, from the data source to the choice of which solution to apply.This book provides a number of tools that can be the starting point for any project requiring graphical representations of data, whether using commercial libraries or your own What youll learnLearn the jqPlot basics.Discover the world of JavaScript graphic libraries.Discover which charts can best represent your data.Switch from a vision of a chart sent from a server as a static image to a highly dynamic one, in which the user is able to interact in real time.Perform input data manipulation to increase chart readability.Who this book is for Create Web Charts with jqPlot is for developers at all levels interested in data visualization, and ready to embrace modern web standards and animate and display their data with powerful, cutting-edge technologies. Table of ContentsCharting Technology OverviewjQuery BasicsIntroducing jqPlotLine Charts with jqPlotBar Charts with jqPlotPie Charts and Donut Charts with jqPlotCandlestick Charts with jqPlotScatter Charts and Bubble Charts with jqPlotFunnel Charts with jqPlotAdding Controls to ChartsEmbedding jqPlot Charts in jQuery WidgetsHandling Input DataApp A: Guidelines for the Examples in the BookApp B: jqPlot Plugins
Download Link:
Related Books:
Create Web Charts with D3
Create Web Charts with D3 shows how to convert your data into eye-catching, innovative, animated, and highly interactive browser-based charts. This book is suitable for developers of all experience levels and needs: if you want power and control and need to create data visualization beyond traditional charts, then D3 is the JavaScript library for you.By the end of the book, you will have a good knowledge of all the elements needed to manage data from every possible source, from high-end scientific instruments to Arduino boards, from PHP SQL databases queries to simple HTML tables, and from Matlab calculations to reports in Excel. This book contains content previously published in Beginning JavaScript Charts.Create all kinds of charts using the latest...
Beginning JavaScript Charts
With jqPlot, d3, and Highcharts
BeginningJavaScript Charts shows how to convert your data into eye-catching, innovative, animated, and highly interactive browser-based charts. This book is suitable for developers of all experience levels and needs: for those who love fast and effective solutions, you can use the jqPlot library to generate charts with amazing effects and animations using only a few lines of code; if you want more power and need to create data visualization beyond traditional charts, then D3 is the JavaScript library for you; finally, if you need a high-performance, professional solution for interactive charts, then the Highcharts library is also covered.If you are an experienced developer and want to take things further, thenBeginningJavaScript Charts also shows you...
Create Dynamic Charts in Microsoft Office Excel 2007
Extend your Excel 2007 skills and create more-powerful and compelling charts in less time. Guided by an Excel expert, you will learn how to turn flat, static charts into dynamic solutions where you can visualize and manipulate data countless ways with a simple mouse click. Get the hands-on practice and examples you need to produce your own, professional-quality results. No programming required! Maximize the impact of your ideas and data! Learn how your design decisions affect perception and comprehension. Match the right chart type to your communication objective. Visualize then buildyour solution using the author's five-step approach. Apply the science of color to make the right things pop. Add controls such as drop-down lists and scroll bars withou...
2007 - 2021 © eBooks-IT.org


