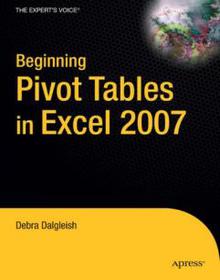
Beginning PivotTables in Excel 2007
From Novice to Professional

Book Details:
| Publisher: | Apress |
| Series: | Apress , From Novice To Professional |
| Author: | Debra Dalgleish |
| Edition: | 1 |
| ISBN-10: | 1590598903 |
| ISBN-13: | 9781590598900 |
| Pages: | 295 |
| Published: | Sep 26 2007 |
| Posted: | Nov 19 2014 |
| Language: | English |
| Book format: | |
| Book size: | 8.29 MB |
Book Description:
Beginning PivotTables in Excel 2007 explains what PivotTables are, how you can benefit from using them, how to create them and modify them, and how to use their enhanced features. Using a Pivot Table in Microsoft Office Excel 2007 is a quick and exciting way to slice and dice a large amount of data. Carefully explains the benefits of using Pivot Tables for fast data analysis Provides a step-by-step approach to those new to Pivot Tables Offers tips and tricks that cannot be found elsewhere What youll learn Summarize thousands of records in a PivotTable with a few clicks of the mouse Quickly change the PivotTable layout to view a different summary of the data Filter a PivotTable to focus on one region or the top 10 products Add colors or icons to highlight the high or low results Use calculations to enhance the PivotTable summaries Create visual impact with a pivot chart Who this book is for This book is for Excel users who want to learn about PivotTables. If you work with financial data, logistics records, sales orders, customer service reports, web site statistics, resource tracking, event planning, or any other set of records, a PivotTable can help you review, analyze, monitor, and report on the data. When your reporting requirements change, you can make minor adjustments to the PivotTable, instead of starting a worksheet summary from scratch.
Download Link:
Related Books:
Microsoft Office Excel 2007 Data Analysis
Your Visual Blueprint for Creating and Analyzing Data, Charts, and PivotTables
Welcome to the only guidebook series that takes a visual approach to professional-level computer topics. Open the book and you'll discover step-by-step screen shots that demonstrate over 110 Excel data analysis techniques, including:* Identifying trends in your data*Sorting, filtering, and identifying lists*Creating, editing, and checking formulas*Calculating interest rates and depreciation*Performing simple sorts and filters*Hiding rows or columns in a PivotTable*Adding and removing chart data*Querying an Access database*Assigning digital signatures*Solving a formula with a data table"I was stuck on an Excel problem for two days. Finally, I opened one of your books, and there was a macro to accomplish exactly what I needed! You made me look goo...
Create Dynamic Charts in Microsoft Office Excel 2007
Extend your Excel 2007 skills and create more-powerful and compelling charts in less time. Guided by an Excel expert, you will learn how to turn flat, static charts into dynamic solutions where you can visualize and manipulate data countless ways with a simple mouse click. Get the hands-on practice and examples you need to produce your own, professional-quality results. No programming required! Maximize the impact of your ideas and data! Learn how your design decisions affect perception and comprehension. Match the right chart type to your communication objective. Visualize then buildyour solution using the author's five-step approach. Apply the science of color to make the right things pop. Add controls such as drop-down lists and scroll bars withou...
Excel 2007
All-In-One Desk Reference For Dummies
Master the Ribbon, powerful graphics capabilities, and more!Your one-stop guide to great-looking spreadsheets that actually mean somethingCreate colorful spreadsheets and charts, use Live Preview, and maximize everything Excel 2007 has to offer! Find just what you need to know about using the new Ribbon, designing spreadsheets that communicate, editing and printing them, working with formulas, protecting your data when you collaborate, turning out cool charts, and much more. The included four-color insert highlights the Ribbon, new graphics features, and more!Discover how toCreate dynamic spreadsheets with style galleriesWork with more than 40 new cell stylesAutomate formatting with Live PreviewShare Excel data with other programsUse VBA to write cus...
2007 - 2021 © eBooks-IT.org


