
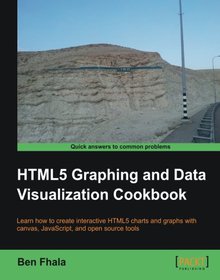
HTML5 Graphing & Data Visualization Cookbook
Book Description:
Learn how to create interactive HTML5 charts and graphs with canvas, JavaScript, and open source tools Overview Build interactive visualizations of data from scratch with integrated animations and events Draw with canvas and other html5 elements that improve your ability to draw directly in the browser Work and improve existing 3rd party charting solutions such as Google Maps In Detail The HTML5 canvas tag makes creating any plot shape easy, all you have to do then is fill it with exciting visualizations written in JavaScript or using other visualization tools. "HTML5 Graphing and Data Visualization Cookbook" is the perfect break into the world of Canvas, charts, and graphs in HTML5 and JavaScript. In this book we will go through a journey of getting to know the technology by creating and planning data-driven visualizations. This cookbook is organized in a linear, progressive way so it can be read from start to finish, as well as be used as a resource for specific tasks. This book travels through the steps involved in creating a fully interactive and animated visualization in HTML5 and JavaScript. You will start from very simple "hello world" samples and quickly dive deeper into the world of graphs and charts in HTML5. Followed by learning how canvas works and carrying out a group of tasks geared at taking what we learned and implementing it in a variety of chart types. With each chapter the content becomes more complex and our creations become more engaging and interactive. Our goal is that by the end of this book you will have a strong foundation; knowing when to create a chart on your own from scratch and when it would be a good idea to depend on other APIs. We finish our book in our last two chapters exploring Google maps and integrating everything we learnt into a full project. What you will learn from this book Creating graphics in Canvas 2D and draw complex shapes Building most of the common charts through step-by-step recipes Adding interactivity to canvas elements and create your own JavaScript animation engine Discovering many fantastic charting solutions and learn how to deal with their capabilities and how to change them as well Learning how to work with Google maps , Google Charts, and Google Docs API Integrating your data into live data, xml driven data, objects, and strings Approach This cookbook is organized in a linear, progressive way allowing it to be read from start to finish, as well as to be used as a useful resource for specific tasks. The HTML5 examples and recipes will have you making dynamic, interactive, and animated charts and graphs in no time. Who this book is written for You don't need to have a background in HTML5 or Canvas but you do need to have a basic understanding of how HTML works and know how to code in any language (preferably in JavaScript). In this book we will not explain how to learn to code but how to create projects and how to plan and execute them in the process.
Download Link:
Related Books:
Python Data Visualization Cookbook
Over 60 recipes that will enable you to learn how to create attractive visualizations using Python's most popular libraries Overview Learn how to set up an optimal Python environment for data visualization Understand the topics such as importing data for visualization and formatting data for visualization Understand the underlying data and how to use the right visualizations In Detail Today, data visualization is a hot topic as a direct result of the vast amount of data created every second. Transforming that data into information is a complex task for data visualization professionals, who, at the same time, try to understand the data and objectively transfer that understanding to others. This book is a set of practical recipes that strive to help ...
Tableau Data Visualization Cookbook
Over 70 recipes for creating visual stories with your data using Tableau Overview Quickly create impressive and effective graphics which would usually take hours in other tools Lots of illustrations to keep you on track Includes examples that apply to a general audience In Detail You know the feeling when you are asked to change or add a certain data point in your graph at the last minute. Usually, you have to scramble to complete the project and risk accuracy; this is not so with Tableau, however. Tableau is a revolutionary toolkit that lets you simply and effectively create high quality data visualizations. "Tableau Data Visualization Cookbook" will show you the exact steps required to generate simple to complex graphics. Whether they a...
Python Data Visualization Cookbook
2nd Edition
Over 70 recipes to get you started with popular Python libraries based on the principal concepts of data visualization About This Book * Learn how to set up an optimal Python environment for data visualization * Understand how to import, clean and organize your data * Determine different approaches to data visualization and how to choose the most appropriate for your needs Who This Book Is For If you already know about Python programming and want to understand data, data formats, data visualization, and how to use Python to visualize data then this book is for you. What You Will Learn * Introduce yourself to the essential tooling to set up your w...
2007 - 2021 © eBooks-IT.org