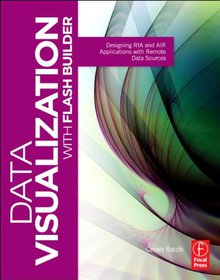
Data Visualization with Flash Builder
Designing RIA and AIR Applications with Remote Data Sources

Book Details:
| Publisher: | Focal Press |
| Series: | Focal Press |
| Author: | Cesare Rocchi |
| Edition: | 1 |
| ISBN-10: | 0240815033 |
| ISBN-13: | 9780240815039 |
| Pages: | 316 |
| Published: | Jan 14 2011 |
| Posted: | Nov 19 2014 |
| Language: | English |
| Book format: | |
| Book size: | 12.28 MB |
Book Description:
Design and create functional applications that interact with remote data sources. You get a thorough introduction to the latest Flash Builder tools learning how you can use the built-in wizards, MXML or pure ActionScript 3 to build information-rich applications for the browser or AIR applications. Hand's on tutorials guide you through each iteration including building user interaction, charting, incorporating audio and video, customizing the UI; and a code repository provides re-usable code that you can modify and deploy in your own applications.
Download Link:
Related Books:
Data Visualization with D3.js Cookbook
Over 70 recipes to create dynamic data-driven visualization with D3.js Overview Create stunning data visualization with the power of D3 Bootstrap D3 quickly with the help of ready-to-go code samples Solve real-world visualization problems with the help of practical recipes In Detail D3.js is a JavaScript library designed to display digital data in dynamic graphical form. It helps you bring data to life using HTML, SVG, and CSS. D3 allows great control over the final visual result, and it is the hottest and most powerful web-based data visualization technology on the market today. "Data Visualization with D3.js Cookbook" is packed with practical recipes to help you learn every aspect of data visualization with D3. "Data Visualization ...
Data Visualization with d3.js
Mold your data into beautiful visualizations with d3.js Overview Build blocks of web visualizations Learn visualization with detailed walkthroughs Learn to use data more effectively Animate with d3.js Design good visualizations In Detail d3.js. provides a platform that help you create your own beautiful visualization and bring data to life using HTML, SVG and CSS. It emphasis on web standards that will fully utilize the capabilities of your web browser. Data Visualization with d3.js walks you through 20 examples in great detail. You can finally stop struggling to piece together examples you've found online. With this book in hand, you will learn enough of the core concepts to conceive of and build your own visualizations from scratch. The book begi...
Social Data Visualization with HTML5 and JavaScript
The increasing adoption of HTML5 opens up a new world of JavaScript-powered visualizations. By harnessing the power of scalable vector graphics (SVGs), you can present even complex data to your users in an easy-to-understand format and improve the user experience by freeing users from the burden of tabular data. Social Data Visualization with HTML5 and JavaScript teaches you how to leverage HTML5 techniques through JavaScript to build visualizations. It also helps to clear up how the often complicated OAuth protocol works to help you unlock a universe of social media data from sites like Twitter, Facebook, and Google+. Social Data Visualization with HTML5 and JavaScript provides you with an introduction to creating an accessible view into the massive...
2007 - 2021 © eBooks-IT.org


