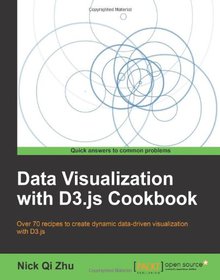
Data Visualization with D3.js Cookbook

Book Details:
| Publisher: | Packt Publishing |
| Series: | Packt , Cookbook |
| Author: | Nick Qi Zhu |
| Edition: | 1 |
| ISBN-10: | 178216216X |
| ISBN-13: | 9781782162162 |
| Pages: | 338 |
| Published: | Oct 24 2013 |
| Posted: | Nov 19 2014 |
| Language: | English |
| Book format: | |
| Book size: | 3.05 MB |
Book Description:
Over 70 recipes to create dynamic data-driven visualization with D3.js Overview Create stunning data visualization with the power of D3 Bootstrap D3 quickly with the help of ready-to-go code samples Solve real-world visualization problems with the help of practical recipes In Detail D3.js is a JavaScript library designed to display digital data in dynamic graphical form. It helps you bring data to life using HTML, SVG, and CSS. D3 allows great control over the final visual result, and it is the hottest and most powerful web-based data visualization technology on the market today. "Data Visualization with D3.js Cookbook" is packed with practical recipes to help you learn every aspect of data visualization with D3. "Data Visualization with D3.js Cookbook" is designed to provide you with all the guidance you need to get to grips with data visualization with D3. With this book, you will create breathtaking data visualization with professional efficiency and precision with the help of practical recipes, illustrations, and code samples. "Data Visualization with D3.js Cookbook" starts off by touching upon data visualization and D3 basics before gradually taking you through a number of practical recipes covering a wide range of topics you need to know about D3. You will learn the fundamental concepts of data visualization, functional JavaScript, and D3 fundamentals including element selection, data binding, animation, and SVG generation. You will also learn how to leverage more advanced techniques such as custom interpolators, custom tweening, timers, the layout manager, force manipulation, and so on. This book also provides a number of pre-built chart recipes with ready-to-go sample code to help you bootstrap quickly. What you will learn from this book Learn how to use functional JavaScript so you can write it the D3 way Select and manipulate HTML and SVG elements efficiently in D3 Drive your visualization using data Master D3 scales and interpolators Animate your visualization with style Use SVG and various D3 path generators Explore D3 layouts and understand and leverage D3 force Build mobile-first interactive visualization with touch support Test-drive your visualization implementation Build multi-dimensional data visualization with crossfilter and dc.js in minutes Approach Packed with practical recipes, this is a step-by-step guide to learning data visualization with D3 with the help of detailed illustrations and code samples. Who this book is written for If you are a developer familiar with HTML, CSS, and JavaScript, and you wish to get the most out of D3, then this book is for you. This book can also serve as a desktop quick-reference guide for experienced data visualization developers.
Download Link:
Related Books:
Data Visualization with d3.js
Mold your data into beautiful visualizations with d3.js Overview Build blocks of web visualizations Learn visualization with detailed walkthroughs Learn to use data more effectively Animate with d3.js Design good visualizations In Detail d3.js. provides a platform that help you create your own beautiful visualization and bring data to life using HTML, SVG and CSS. It emphasis on web standards that will fully utilize the capabilities of your web browser. Data Visualization with d3.js walks you through 20 examples in great detail. You can finally stop struggling to piece together examples you've found online. With this book in hand, you will learn enough of the core concepts to conceive of and build your own visualizations from scratch. The book begi...
D3.js in Action
SummaryD3.js in Action is a practical tutorial for creating interactive graphics and data-driven applications using D3.js. You'll start with in-depth explanations of D3's out-of-the-box layouts, along with dozens of practical use cases that align with different types of visualizations. Then, you'll explore practical techniques for content creation, animation, and representing dynamic data-including interactive graphics and data streamed live over the web. The final chapters show you how to use D3's rich interaction model as the foundation for a complete web application. In the end, you'll be ready to integrate D3.js into your web development process and transform any site into a more engaging and sophisticated user experience.Purchase of the print bo...
HTML5 Graphing & Data Visualization Cookbook
Learn how to create interactive HTML5 charts and graphs with canvas, JavaScript, and open source tools Overview Build interactive visualizations of data from scratch with integrated animations and events Draw with canvas and other html5 elements that improve your ability to draw directly in the browser Work and improve existing 3rd party charting solutions such as Google Maps In Detail The HTML5 canvas tag makes creating any plot shape easy, all you have to do then is fill it with exciting visualizations written in JavaScript or using other visualization tools. "HTML5 Graphing and Data Visualization Cookbook" is the perfect break into the world of Canvas, charts, and graphs in HTML5 and JavaScript. In this book we will go through a journe...
2007 - 2021 © eBooks-IT.org


