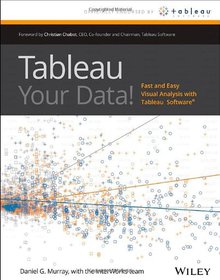
Tableau Your Data
Fast and Easy Visual Analysis with Tableau Software

Book Details:
| Publisher: | Wiley |
| Series: | Wiley |
| Author: | Dan Murray |
| Edition: | 1 |
| ISBN-10: | 1118612043 |
| ISBN-13: | 9781118612040 |
| Pages: | 528 |
| Published: | Nov 11 2013 |
| Posted: | Nov 19 2014 |
| Language: | English |
| Book format: | |
| Book size: | 33.51 MB |
Book Description:
Best practices and step-by-step instructions for using the Tableau Software toolsetAlthough the Tableau Desktop interface is relatively intuitive, this book goes beyond the simple mechanics of the interface to show best practices for creating effective visualizations for specific business intelligence objectives. It illustrates little-known features and techniques for getting the most from the Tableau toolset, supporting the needs of the business analysts who use the product as well as the data and IT managers who support it.This comprehensive guide covers the core feature set for data analytics, illustrating best practices for creating and sharing specific types of dynamic data visualizations. Featuring a helpful full-color layout, the book covers analyzing data with Tableau Desktop, sharing information with Tableau Server, understanding Tableau functions and calculations, and Use Cases for Tableau Software. Includes little-known, as well as more advanced features and techniques, using detailed, real-world case studies that the author has developed as part of his consulting and training practiceExplains why and how Tableau differs from traditional business information analysis toolsShows you how to deploy dashboards and visualizations throughout the enterpriseProvides a detailed reference resource that is aimed at users of all skill levelsDepicts ways to leverage Tableau across the value chain in the enterprise through case studies that target common business requirementsEndorsed by Tableau SoftwareTableau Your Data shows you how to build dynamic, best-of-breed visualizations using the Tableau Software toolset.
Download Link:
Related Books:
Access Hacks
Tips & Tools for Wrangling Your Data
As part of the Microsoft Office suite, Access has become the industry's leading desktop database management program for organizing, accessing, and sharing information. But taking advantage of this product to build increasingly complex Access applications requires something more than your typical how-to book. What it calls for is Access Hacks from O'Reilly.This valuable guide provides direct, hands-on solutions that can help relieve the frustrations felt by users struggling to master the program's various complexities. For experienced users, Access Hacks offers a unique collection of proven techniques and tools that enable them to take their database skills and productivity to the next level. For Access beginners, it helps them acquire a firm grasp of...
Selecting the Right Analyses for Your Data
Quantitative, Qualitative and Mixed Methods
What are the most effective methods to code and analyze data for a particular study? This thoughtful and engaging book reviews the selection criteria for coding and analyzing any set of data--whether qualitative, quantitative, mixed, or visual. The authors systematically explain when to use verbal, numerical, graphic, or combined codes, and when to use qualitative, quantitative, graphic, or mixed-methods modes of analysis. Chapters on each topic are organized so that researchers can read them sequentially or can easily "flip and find" answers to specific questions. Nontechnical discussions of cutting-edge approaches--illustrated with real-world examples--emphasize how to choose (rather than how to implement) the various analyses. The book s...
Communicating Data with Tableau
Go beyond spreadsheets and tables and design a data presentation that really makes an impact. This practical guide shows you how to use Tableau Software to convert raw data into compelling data visualizations that provide insight or allow viewers to explore the data for themselves.Ideal for analysts, engineers, marketers, journalists, and researchers, this book describes the principles of communicating data and takes you on an in-depth tour of common visualization methods. You'll learn how to craft articulate and creative data visualizations with Tableau Desktop 8.1 and Tableau Public 8.1.Present comparisons of how much and how manyUse blended data sources to create ratios and ratesCreate charts to depict proportions and percentagesVisualize measures...
2007 - 2021 © eBooks-IT.org


