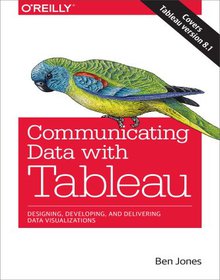
Communicating Data with Tableau
Book Description:
Go beyond spreadsheets and tables and design a data presentation that really makes an impact. This practical guide shows you how to use Tableau Software to convert raw data into compelling data visualizations that provide insight or allow viewers to explore the data for themselves.Ideal for analysts, engineers, marketers, journalists, and researchers, this book describes the principles of communicating data and takes you on an in-depth tour of common visualization methods. You'll learn how to craft articulate and creative data visualizations with Tableau Desktop 8.1 and Tableau Public 8.1.Present comparisons of how much and how manyUse blended data sources to create ratios and ratesCreate charts to depict proportions and percentagesVisualize measures of mean, median, and modeLean how to deal with variation and uncertaintyCommunicate multiple quantities in the same viewShow how quantities and events change over timeUse maps to communicate positional dataBuild dashboards to combine several visualizations
Download Link:
Related Books:
Tableau Your Data
Fast and Easy Visual Analysis with Tableau Software
Best practices and step-by-step instructions for using the Tableau Software toolsetAlthough the Tableau Desktop interface is relatively intuitive, this book goes beyond the simple mechanics of the interface to show best practices for creating effective visualizations for specific business intelligence objectives. It illustrates little-known features and techniques for getting the most from the Tableau toolset, supporting the needs of the business analysts who use the product as well as the data and IT managers who support it.This comprehensive guide covers the core feature set for data analytics, illustrating best practices for creating and sharing specific types of dynamic data visualizations. Featuring a helpful full-color layout, the book covers a...
Rapid Graphs with Tableau 8
The Original Guide for the Accidental Analyst
Tired of boring spreadsheets and data overload from confusing graphs? Master the art of visualization with Rapid Graphs with Tableau 8! Tableau insiders Stephen and Eileen McDaniel expertly provide a hands-on case study approach and more than 225 illustrations that will teach you how to quickly explore and understand your data to make informed decisions in a wide variety of real-world situations. Rapid Graphs with Tableau 8 includes best practices of visual analytics for ideas on how to communicate your findings with audience-friendly graphs, tables and maps."A picture is worth a thousand words" is a common saying that is more relevant today than ever as data volumes grow and the need for easy access to answers becomes more critical. This b...
Exploring Data with RapidMiner
Explore, understand, and prepare real data using RapidMiner's practical tips and tricks Overview See how to import, parse, and structure your data quickly and effectively Understand the visualization possibilities and be inspired to use these with your own data Structured in a modular way to adhere to standard industry processes In Detail Data is everywhere and the amount is increasing so much that the gap between what people can understand and what is available is widening relentlessly. There is a huge value in data, but much of this value lies untapped. 80% of data mining is about understanding data, exploring it, cleaning it, and structuring it so that it can be mined. RapidMiner is an environment for machine learning, data mining, text mining, ...
2007 - 2021 © eBooks-IT.org


