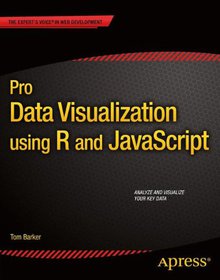
Pro Data Visualization using R and JavaScript

Book Details:
| Publisher: | Apress |
| Series: | Apress , Using |
| Author: | Tom Barker |
| Edition: | 1 |
| ISBN-10: | 1430258063 |
| ISBN-13: | 9781430258063 |
| Pages: | 216 |
| Published: | Jun 19 2013 |
| Posted: | Nov 19 2014 |
| Language: | English |
| Book format: | |
| Book size: | 8.8 MB |
Book Description:
Pro Data Visualization using R and JavaScript makes the R language approachable, and promotes the idea of data gathering and analysis. You'll see how to use R to interrogate and analyze your data, and then use the D3 JavaScript library to format and display that data in an elegant, informative, and interactive way. You will learn how to gather data effectively, and also how to understand the philosophy and implementation of each type of chart, so as to be able to represent the results visually. With the popularity of the R language, the art and practice of creating data visualizations is no longer the preserve ofmathematicians, statisticians, or cartographers. As technology leaders, we can gather metrics around what we do and use data visualizations to communicate that information. Pro Data Visualization using R and JavaScript combines the power of the R language with the simplicity and familiarity of JavaScript to display clear and informative data visualizations. Gathering and analyzing empirical data is the key to truly understanding anything. We can track operational metrics to quantify the health of our products in production. We can track quality metrics of our projects, and even use our data to identify bad code. Visualizing this data allows anyone to read our analysis and easily get a deep understanding of the story the data tells. What youll learn A rich understanding of how to gather, and analyzeempirical data How to tell a story with data using data visualizations What types of data visualizations are best to use for the story that you want to tell with your data A comprehensive introduction to the R language, covering all the essentials Exploration of how to construct interactive data visualizations using JavaScript and JavaScript libraries Who this book is for Developers at all levels interested in data visualization,beginning to intermediate engineering managers, statisticians, mathematicians, economists and any others interested in data visualization. Table of Contents Techniques for Data Visualization The R Language A Deeper Dive into R Data Visualization with D3 Visualizing Spatial Information from Access Logs (Data Maps) Visualizing Defects over Time (Time Series) Bar Charts Correlation Analysis with Team Dynamics (Scatterplot and Bubble Chart) Balancing Delivery with Quality (Parallel Coordinates Chart)
Download Link:
Related Books:
Social Data Visualization with HTML5 and JavaScript
The increasing adoption of HTML5 opens up a new world of JavaScript-powered visualizations. By harnessing the power of scalable vector graphics (SVGs), you can present even complex data to your users in an easy-to-understand format and improve the user experience by freeing users from the burden of tabular data. Social Data Visualization with HTML5 and JavaScript teaches you how to leverage HTML5 techniques through JavaScript to build visualizations. It also helps to clear up how the often complicated OAuth protocol works to help you unlock a universe of social media data from sites like Twitter, Facebook, and Google+. Social Data Visualization with HTML5 and JavaScript provides you with an introduction to creating an accessible view into the massive...
Interactive Data Visualization
Foundations, Techniques, and Applications
Visualization is the process of representing data, information, and knowledge in a visual form to support the tasks of exploration, confirmation, presentation, and understanding. This book is designed as a textbook for students, researchers, analysts, professionals, and designers of visualization techniques, tools, and systems. It covers the full spectrum of the field, including mathematical and analytical aspects, ranging from its foundations to human visual perception; from coded algorithms for different types of data, information and tasks to the design and evaluation of new visualization techniques. Sample programs are provided as starting points for building one's own visualization tools. Numerous data sets have been made available that highlig...
Big Data Analytics with R and Hadoop
Set up an integrated infrastructure of R and Hadoop to turn your data analytics into Big Data analytics Overview Write Hadoop MapReduce within R Learn data analytics with R and the Hadoop platform Handle HDFS data within R Understand Hadoop streaming with R Encode and enrich datasets into R In Detail Big data analytics is the process of examining large amounts of data of a variety of types to uncover hidden patterns, unknown correlations, and other useful information. Such information can provide competitive advantages over rival organizations and result in business benefits, such as more effective marketing and increased revenue. New methods of working with big data, such as Hadoop and MapReduce, offer alternatives to traditional data warehousing....
2007 - 2021 © eBooks-IT.org


