Tom Barker eBooks
Download free Tom Barker eBooks
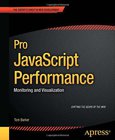
Pro JavaScript Performance
Monitoring and Visualization
Performance is a hugely important area of web development. If your site runs slowly, users are going to leave, and the problem only grows as your site gets more popular. Pro JavaScript Performance gives you the tools you need to keep your sitessmooth and responsive no matter how many users you have. Best practices are changing or becoming redefined continually because of changes and optimizations at the interpreter level, and differences in system configuration, and network speeds. This is exacerbated by the quickened release schedule that most browsers have adopted. Just as important as following best practices is the ability to measure your own performance, so that you can adjust as times change, and so that you can note the subtle nuances in yo...
Foundation Website Creation
With HTML5, CSS3 and JavaScript
Foundation Website Creation with HTML5, CSS3, and JavaScript shows the entire process of building a website. This process involves much more than just technical knowledge, and this book providesall the information you'll need to understand the concepts behind designing and developing for the Web, as well as the best means to deliver professional results based onbest practices. Of course, there is far more to building a successful website than knowing a little Hypertext Markup Language (HTML). The process starts long before any coding takes place, and this book introduces you to the agile development process, explaining why this method makes so much sense for web projects and how best to implement it. We also make sure you're up to date by using the...
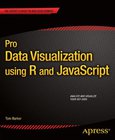
Pro Data Visualization using R and JavaScript
Pro Data Visualization using R and JavaScript makes the R language approachable, and promotes the idea of data gathering and analysis. You'll see how to use R to interrogate and analyze your data, and then use the D3 JavaScript library to format and display that data in an elegant, informative, and interactive way. You will learn how to gather data effectively, and also how to understand the philosophy and implementation of each type of chart, so as to be able to represent the results visually. With the popularity of the R language, the art and practice of creating data visualizations is no longer the preserve ofmathematicians, statisticians, or cartographers. As technology leaders, we can gather metrics around what we do and use data visualizations...
2007 - 2017 © eBooks-IT.org


