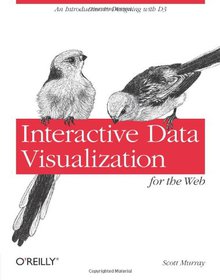
Interactive Data Visualization
For the Web

Book Details:
| Publisher: | O'Reilly Media |
| Series: | OReilly |
| Author: | Scott Murray |
| Edition: | 1 |
| ISBN-10: | 1449339735 |
| ISBN-13: | 9781449339739 |
| Pages: | 272 |
| Published: | Apr 02 2013 |
| Posted: | Nov 19 2014 |
| Language: | English |
| Book format: | |
| Book size: | 10.49 MB |
Book Description:
Create and publish your own interactive data visualization projects on the Webeven if you have little or no experience with data visualization or web development. It's easy and fun with this practical, hands-on introduction. Author Scott Murray teaches you the fundamental concepts and methods of D3, a JavaScript library that lets you express data visually in a web browser. Along the way, you'll expand your web programming skills, using tools such as HTML and JavaScript. This step-by-step guide is ideal whether you're a designer or visual artist with no programming experience, a reporter exploring the new frontier of data journalism, or anyone who wants to visualize and share data. Learn HTML, CSS, JavaScript, and SVG basics Dynamically generate web page elements from your dataand choose visual encoding rules to style them Create bar charts, scatter plots, pie charts, stacked bar charts, and force-directed layouts Use smooth, animated transitions to show changes in your data Introduce interactivity to help users explore data through different views Create customized geographic maps with data Explore hands-on with downloadable code and over 100 examples
Download Link:
Related Books:
Interactive Data Visualization
Foundations, Techniques, and Applications
Visualization is the process of representing data, information, and knowledge in a visual form to support the tasks of exploration, confirmation, presentation, and understanding. This book is designed as a textbook for students, researchers, analysts, professionals, and designers of visualization techniques, tools, and systems. It covers the full spectrum of the field, including mathematical and analytical aspects, ranging from its foundations to human visual perception; from coded algorithms for different types of data, information and tasks to the design and evaluation of new visualization techniques. Sample programs are provided as starting points for building one's own visualization tools. Numerous data sets have been made available that highlig...
Learning IPython for Interactive Computing and Data Visualization
Learn IPython for interactive Python programming, high-performance numerical computing, and data visualization Overview A practical step-by-step tutorial which will help you to replace the Python console with the powerful IPython command-line interface Use the IPython notebook to modernize the way you interact with Python Perform highly efficient computations with NumPy and Pandas Optimize your code using parallel computing and Cython In Detail You already use Python as a scripting language, but did you know it is also increasingly used for scientific computing and data analysis? Interactive programming is essential in such exploratory tasks and IPython is the perfect tool for that. Once youve learnt it, you won't be able to live without it. "...
Data Visualization with Flash Builder
Designing RIA and AIR Applications with Remote Data Sources
Design and create functional applications that interact with remote data sources. You get a thorough introduction to the latest Flash Builder tools learning how you can use the built-in wizards, MXML or pure ActionScript 3 to build information-rich applications for the browser or AIR applications. Hand's on tutorials guide you through each iteration including building user interaction, charting, incorporating audio and video, customizing the UI; and a code repository provides re-usable code that you can modify and deploy in your own applications....
2007 - 2021 © eBooks-IT.org


