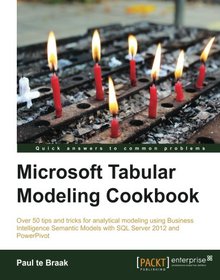
Microsoft Tabular Modeling Cookbook

Book Details:
| Publisher: | Packt Publishing |
| Series: | Packt , Cookbook |
| Author: | Paul te Braak |
| Edition: | 1 |
| ISBN-10: | 178217088X |
| ISBN-13: | 9781782170884 |
| Pages: | 320 |
| Published: | Dec 24 2013 |
| Posted: | Nov 19 2014 |
| Language: | English |
| Book format: | |
| Book size: | 6.79 MB |
Book Description:
Over 50 tips and tricks for analytical modeling using Business Intelligence Semantic Models with SQL Server 2012 and PowerPivot Overview Develop tabular models for personal use Learn about the modeling techniques which are required to overcome commonly encountered problems and master advanced modeling scenarios Understand the techniques required to promote personal models to corporate enterprise environments and manage the models in a corporate environment Learn tips and tricks for querying tabular models and learn how to access the data within them for dynamic reporting including the development of interactive workbooks In Detail Business Intelligence Semantic Models (BISM) is a technology that is designed to deliver analytical information to users through a variety of mechanisms that include model structure, definition, and design. This book demonstrates how to create BISM models so that information can be presented to users in an intuitive and easy-to-use format. Once the model is defined, we also show you how it can be managed and maintained so that the data in it remains current and secure. Microsoft Tabular Modeling Cookbook is an all-encompassing guide to developing, managing, creating, and using analytical models using the Business Intelligence Semantic Model (BISM). This title covers a range of modeling situations and common data analysis related problems to show you the techniques required to turn data into information using tabular modeling. Microsoft Tabular Modeling Cookbook examines three areas of tabular modeling: model development, model management and maintenance, and reporting. This book is a practical guide on how to develop semantic models and turn business data into information. It covers all phases of the model lifecycle from creation to administration and finally reporting. It also shows you how to create models which are designed to analyze data. All sections of BISM modeling from development to management and finally reporting are covered. The sections on development examine a wide range of techniques and tricks required to build models, including moving data into the model, structuring the model to manipulate the data, and finally the formulas required to answer common business questions; all of these are discussed in this book in detail. Finally, the book examines methods of reporting on the data within the model, including the creation of data-driven workbooks and reports for a powerful end user experience. What you will learn from this book Create tabular models which present custom information to users Create simple and complex DAX formulas and measures that address business questions and concerns Learn the basics of tabular modeling and how to structure the model and control what information is presented to the user Understand the methods of importing data into the model and the techniques to manage the data access components of the model Learn about the DAX calculations and modeling concepts required to present custom-specific user requirements to model users Explore the techniques required to promote and manage tabular models in corporate environments Learn methods to report and query on the data within the model Understand the techniques required to extend the native reporting capabilities in Excel through the use of Visual Basic for Application (VBA) within workbooks in order to provide a rich and customizable reporting framework for users
Download Link:
Related Books:
Microsoft Application Virtualization Cookbook
Over 55 hands-on recipes covering the key aspects of a successful App-V deployment About This Book * Deploy a resilient App-V infrastructure * Combine App-V with Remote Desktop Services, Citrix XenDesktop, and System Center Configuration Manager * Discover Shared Content Store Mode, Scripting, and Connection Groups to extend your deployment In Detail With an ever-increasing number of applications being deployed in the workplace, Microsoft App-V 5 enables administrators to abstract these applications from clients, in turn reducing the time taken to complete the software deployment lifecycle. Part of the Microsoft Desktop Optimization Pack, App-V 5 centralizes the management of applications with a variety of deployment methods to suit each environm...
Microsoft Office Excel 2007
Data Analysis and Business Modeling
Master the analysis and business modeling techniques that help you transform your data into bottom-line results. Award-winning business professor and corporate consultant Wayne Winston shares the best of his real-world experience in this practical guidenow updated for Excel 2007. Use Wayne's proven practices and hands-on exercises to help you work smarter, make better decisions, and gain the competitive edge.Solve real-world business problems with Excel 2007! Maximize profitsdetermine NPV, optimize your product mix, calculate ROI Create best, worst, and most-likely case scenarios for sales Analyze investment performance and help minimize risk Track your personal finances, calculate loan terms, and plan for retirement Use trend and seasonality to fore...
Microsoft Excel 2013
Data Analysis and Business Modeling
Master business modeling and analysis techniques with Microsoft Excel 2013, and transform data into bottom-line results. Written by award-winning educator Wayne Winston, this hands-on, scenario-focused guide shows you how to use the latest Excel tools to integrate data from multiple tables-and how to effectively build a relational data source inside an Excel workbook. Solve real business problems with Excel-and sharpen your edge Summarize data with PivotTables and Descriptive Statistics Explore new trends in predictive and prescriptive analytics Use Excel Trend Curves, multiple regression, and exponential smoothing Master advanced Excel functions such as OFFSET and INDIRECT Delve into key financial, statistical, and time functions Make your charts ...
2007 - 2021 © eBooks-IT.org


