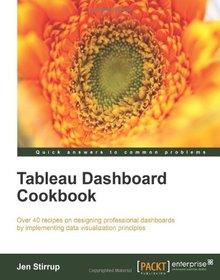
Tableau Dashboard Cookbook

Book Details:
| Publisher: | Packt Publishing |
| Series: | Packt , Cookbook |
| Author: | Jen Stirrup |
| Edition: | 1 |
| ISBN-10: | 1782177906 |
| ISBN-13: | 9781782177906 |
| Pages: | 322 |
| Published: | May 26 2014 |
| Posted: | Nov 19 2014 |
| Language: | English |
| Book format: | |
| Book size: | 13.18 MB |
Book Description:
Over 40 recipes on designing professional dashboards by implementing data visualization principles with this book and ebook Overview Utilize the features of Tableau to create, design, and develop effective, beautiful dashboards Use data visualization principles to help you to design dashboards that enlighten and support business decisions Explore Tableau's functionality with practical lessons that help you to build your own solution as you progress through the book In Detail With increasing interest and enthusiasm for data visualization in the media, businesses are looking to create effective dashboards that engage as well as communicate the truth of data. Tableau makes data accessible to everyone, and is a great way of sharing enterprise dashboards across your business. The deceptively simple Tableau interface hides a variety and complexity of features available for dashboarding, and this book will help you to become familiar with these features.This book will familiarize you with the features of Tableau and enable you to develop and enhance your dashboard skills, starting with an overview of what dashboard is, followed by how you can collect data using various mathematical formulas. It will also walk you through the various features of Tableau including dual axes, scatterplot matrices, heat maps, and sizing. Finally, this book will help you consider what to do next with your dashboard, whether it's on a server or in collaboration with other tools. What you will learn from this book Customize your designs to meet the needs of your business using Tableau Use Tableau to prototype, develop, and deploy the final dashboard Communicate and share your dashboards internally within your business, or externally with the rest of the world via Tableau public Integrate your data to provide mashed-up dashboards Be inspired with color, motion, and other design tricks when designing dashboards Formulate your business rules into Tableau formulae that you can reuse Consider your business users and data consumer needs as you learn about color theory and psychology, and put them into action Approach This book follows a step by step approach to taking a data source and building up a series of dashboard elements, ultimately resulting in a series of dashboards for your business. Each topic is explained sequentially in the process of creating a dashboard from design to delivery. There are also detailed explanations of the basic and advanced features of Tableau that serve the needs of dashboard artists.
Download Link:
Related Books:
Tableau Data Visualization Cookbook
Over 70 recipes for creating visual stories with your data using Tableau Overview Quickly create impressive and effective graphics which would usually take hours in other tools Lots of illustrations to keep you on track Includes examples that apply to a general audience In Detail You know the feeling when you are asked to change or add a certain data point in your graph at the last minute. Usually, you have to scramble to complete the project and risk accuracy; this is not so with Tableau, however. Tableau is a revolutionary toolkit that lets you simply and effectively create high quality data visualizations. "Tableau Data Visualization Cookbook" will show you the exact steps required to generate simple to complex graphics. Whether they a...
Tableau Your Data
Fast and Easy Visual Analysis with Tableau Software
Best practices and step-by-step instructions for using the Tableau Software toolsetAlthough the Tableau Desktop interface is relatively intuitive, this book goes beyond the simple mechanics of the interface to show best practices for creating effective visualizations for specific business intelligence objectives. It illustrates little-known features and techniques for getting the most from the Tableau toolset, supporting the needs of the business analysts who use the product as well as the data and IT managers who support it.This comprehensive guide covers the core feature set for data analytics, illustrating best practices for creating and sharing specific types of dynamic data visualizations. Featuring a helpful full-color layout, the book covers a...
Rapid Graphs with Tableau 8
The Original Guide for the Accidental Analyst
Tired of boring spreadsheets and data overload from confusing graphs? Master the art of visualization with Rapid Graphs with Tableau 8! Tableau insiders Stephen and Eileen McDaniel expertly provide a hands-on case study approach and more than 225 illustrations that will teach you how to quickly explore and understand your data to make informed decisions in a wide variety of real-world situations. Rapid Graphs with Tableau 8 includes best practices of visual analytics for ideas on how to communicate your findings with audience-friendly graphs, tables and maps."A picture is worth a thousand words" is a common saying that is more relevant today than ever as data volumes grow and the need for easy access to answers becomes more critical. This b...
2007 - 2021 © eBooks-IT.org


