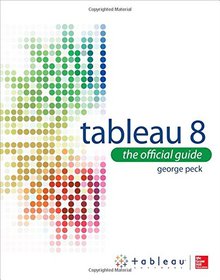
Tableau 8
The Official Guide

Book Details:
| Publisher: | McGraw-Hill Osborne Media |
| Series: | McGraw Hill |
| Author: | George Peck |
| Edition: | 1 |
| ISBN-10: | 007181678X |
| ISBN-13: | 9780071816786 |
| Pages: | 230 |
| Published: | Aug 20 2013 |
| Posted: | Apr 02 2015 |
| Language: | English |
| Book format: | |
| Book size: | 37.34 MB |
Book Description:
Present a unified view of complex BI using the entire Tableau 8 toolkit Create and distribute dynamic, feature-rich data visualizations and highly interactive BI dashboards-quickly and easily! Tableau 8: The Official Guide provides the hands-on instruction and best practices you need to meet your business intelligence objectives and drive better decision making. Discover how to work from the Tableau GUI, load BI from disparate sources, drag and drop to analyze data, set up custom visualizations, and build robust dashboards. This practical guide shows you, step by step, how to design and publish meaningful business communications to end users across your enterprise. Navigate the Tableau user interface and data window Connect to spreadsheets, databases, and other sources Select data fields and drag them to desired screen locations Work with pre-defined visualizations and sample workbooks Display background maps and perform geographic analysis Add calculated fields, graphs, charts, tables, and statistics Combine multiple data sources into real-time dashboards Export your visualizations to the Web or in various file formats Electronic content includes: Videos that demonstrate the techniques presented in the book Sample Tableau workbooks
Download Link:
Related Books:
Rapid Graphs with Tableau 8
The Original Guide for the Accidental Analyst
Tired of boring spreadsheets and data overload from confusing graphs? Master the art of visualization with Rapid Graphs with Tableau 8! Tableau insiders Stephen and Eileen McDaniel expertly provide a hands-on case study approach and more than 225 illustrations that will teach you how to quickly explore and understand your data to make informed decisions in a wide variety of real-world situations. Rapid Graphs with Tableau 8 includes best practices of visual analytics for ideas on how to communicate your findings with audience-friendly graphs, tables and maps."A picture is worth a thousand words" is a common saying that is more relevant today than ever as data volumes grow and the need for easy access to answers becomes more critical. This b...
Tableau Your Data
Fast and Easy Visual Analysis with Tableau Software
Best practices and step-by-step instructions for using the Tableau Software toolsetAlthough the Tableau Desktop interface is relatively intuitive, this book goes beyond the simple mechanics of the interface to show best practices for creating effective visualizations for specific business intelligence objectives. It illustrates little-known features and techniques for getting the most from the Tableau toolset, supporting the needs of the business analysts who use the product as well as the data and IT managers who support it.This comprehensive guide covers the core feature set for data analytics, illustrating best practices for creating and sharing specific types of dynamic data visualizations. Featuring a helpful full-color layout, the book covers a...
Communicating Data with Tableau
Go beyond spreadsheets and tables and design a data presentation that really makes an impact. This practical guide shows you how to use Tableau Software to convert raw data into compelling data visualizations that provide insight or allow viewers to explore the data for themselves.Ideal for analysts, engineers, marketers, journalists, and researchers, this book describes the principles of communicating data and takes you on an in-depth tour of common visualization methods. You'll learn how to craft articulate and creative data visualizations with Tableau Desktop 8.1 and Tableau Public 8.1.Present comparisons of how much and how manyUse blended data sources to create ratios and ratesCreate charts to depict proportions and percentagesVisualize measures...
2007 - 2021 © eBooks-IT.org


