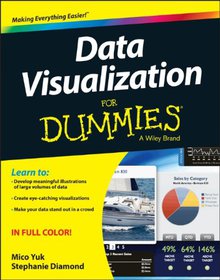
Data Visualization For Dummies

Book Details:
| Publisher: | For Dummies |
| Series: | Wiley , For Dummies |
| Author: | Stephanie Diamond |
| Edition: | 1 |
| ISBN-10: | 1118502892 |
| ISBN-13: | 9781118502891 |
| Pages: | 256 |
| Published: | Jan 21 2014 |
| Posted: | Nov 19 2014 |
| Language: | English |
| Book format: | |
| Book size: | 22.58 MB |
Book Description:
A straightforward, full-color guide to showcasing data so your audience can see what you mean, not just read about itBig data is big news! Every company, industry, not-for-profit, and government agency wants and needs to analyze and leverage datasets that can quickly become ponderously large. Data visualization software enables different industries to present information in ways that are memorable and relevant to their mission. This full-color guide introduces you to a variety of ways to handle and synthesize data in much more interesting ways than mere columns and rows of numbers. Learn meaningful ways to show trending and relationships, how to convey complex data in a clear, concise diagram, ways to create eye-catching visualizations, and much more!Effective data analysis involves learning how to synthesize data, especially big data, into a story and present that story in a way that resonates with the audienceThis full-color guide shows you how to analyze large amounts of data, communicate complex data in a meaningful way, and quickly slice data into various viewsExplains how to automate redundant reporting and analyses, create eye-catching visualizations, and use statistical graphics and thematic cartographyEnables you to present vast amounts of data in ways that won't overwhelm your audiencePart technical manual and part analytical guidebook, Data Visualization For Dummies is the perfect tool for transforming dull tables and charts into high-impact visuals your audience will notice...and remember.
Download Link:
Related Books:
Interactive Data Visualization
For the Web
Create and publish your own interactive data visualization projects on the Webeven if you have little or no experience with data visualization or web development. It's easy and fun with this practical, hands-on introduction. Author Scott Murray teaches you the fundamental concepts and methods of D3, a JavaScript library that lets you express data visually in a web browser. Along the way, you'll expand your web programming skills, using tools such as HTML and JavaScript. This step-by-step guide is ideal whether you're a designer or visual artist with no programming experience, a reporter exploring the new frontier of data journalism, or anyone who wants to visualize and share data. Learn HTML, CSS, JavaScript, and SVG basics Dynamically generate web p...
Excel 2007 Data Analysis
For Dummies
Shows ordinary users how to tap the rich data analysis functionality of Excel, make sense of their organization's critical financial and statistical information, and put together compelling data presentationsNow revised with over 30 percent new content to cover the enhancements in Excel 2007, including the completely redesigned user interface, augmented charting and PivotTable capabilities, improved security, and better data exchange through XMLProvides thorough coverage of Excel features that are critical to data analysis-working with external databases, creating PivotTables and PivotCharts, using Excel statistical and financial functions, sharing data, harnessing the Solver, taking advantage of the Small Business Finance Manager, and more...
Excel Data Analysis
For Dummies
2nd Edition
Harness the power of Excel to discover what your numbers are hidingExcel Data Analysis For Dummies, 2nd Edition is the ultimate guide to getting the most out of your data. Veteran Dummies author Stephen L. Nelson guides you through the basic and not-so-basic features of Excel to help you discover the gems hidden in your rough data. From input, to analysis, to visualization, the book walks you through the steps that lead to superior data analysis.Excel is the number-one spreadsheet application, with ever-expanding capabilities. If you're only using it to balance the books, you're missing out on a host of functions that can benefit your business or perso...
2007 - 2021 © eBooks-IT.org


